
I have been a web developer for 10 years but recently started looking into Machine Learning and Data Mining and as such I wanted to dig into some data that would be fun to investigate – so off course I chose the tornado data from SPC to see what I could find. In that 6 Mb+ csv file you can see things like magnitude (EF-0 etc), starting longitude/latitude, state, width, length etc. for “each” tornado between 1950 and 2017. I wrote “each” in quotation marks as not nearly all tornadoes are reported and end up in the data.
Anyway, almost by accident I figured out one could calculate the mean latitude/longitude of all tornadoes that have occurred. These co-ordinates would in fact be the Tornado Capital of USA, at least in terms of geometry. After removing some zero values (that flawed the data) and also excluding the (very few) tornadoes of Hawaii, Alaska, and Puerto Rico I calculated the geometrical average coordinates to be 37.169/-92.833 which happens to be slightly east of Diggins, Missouri!

This was somewhat surprising to me. It’s easy to understand that the center would be east of Tornado Alley as Dixie Alley (southeast USA) get a lot of tornadoes which would mean the center would be somewhere between Dixie Alley and Tornado Alley. It is, however, much further North than I would have guessed – I would have guessed it would be in Arkansas somewhere – again, considering Dixie Alley.

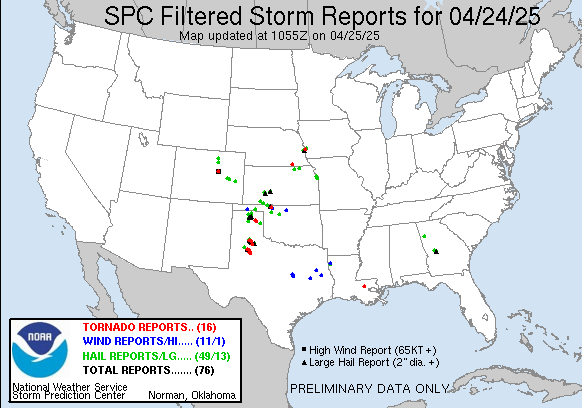
However, if you look at an image of tornado reports like the one above (which happens to be 2009, as there is no map for 1950-2017) you can see that tornados DO occur quite often up north as well. Diggins, MO.
Interestingly enough, the area around Diggins seems to be somewhat of a hotspot for tornadoes as well (as can be seen on this map for example). There was, in fact, a tornado there in August last year.
This is a just a calculation made for fun and does not really hold any real significance. As with any statistics, there are many things to question like the reliability/representativeness of the data and if an average really mean anything considering the country is not perfectly quadratic etc.The data should also be quite heavily tilted towards this milennium as there are far more chasers, cameras & social networks nowadays. A tornado nowadays have a much greater chance of being reported than one in the 1950. Either way, it was a fun calculation to do.


Very Interesting!