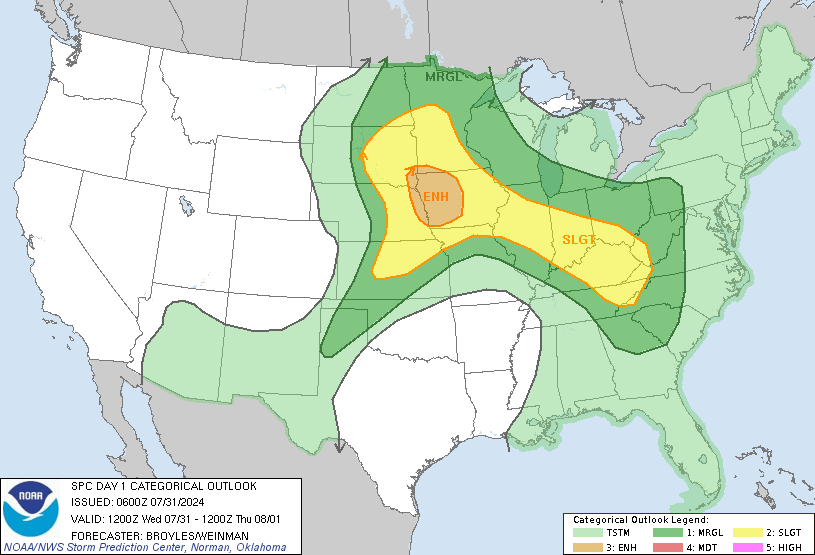
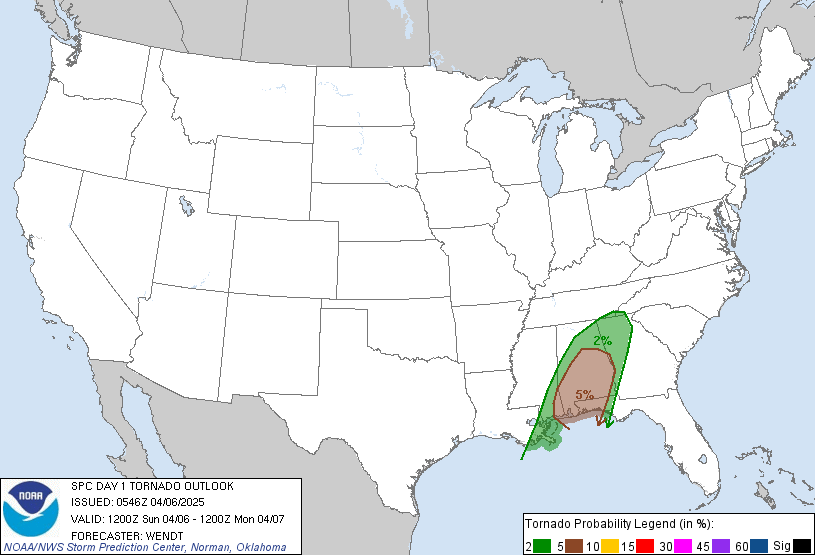
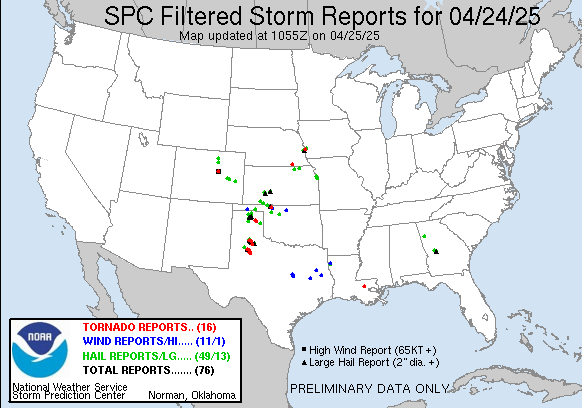
Almost two years ago I started working on StormCenter (formerly named StormWindow), a web application where you can explore and analyze storms, tornadoes and storm chaser activity in the last 24 hours. You can see photos, videos chasers have posted as well as zooming in on a specific time and location. See who was close to a tornado when it happened, how the radar image looked like.
In addition to this I have added an extensive database on historical storms and tornadoes. I have personally been using this to check out how the outlooks and turnouts was on old chasecations I have been on, or to look at how the setup and forecast was on certain significant days such as May 31st 2013.
I have been working on and off with this application and my focus has, to a large extent, been to use it to test new technologies. I am currently working on a completely new frontend using React.js, which I haven’t done any major project with so far, it looks really great!

I have gathered plenty of data about historical events (in the 2000s) and possibilities to extract information on ongoing storms, but a the moment my main bottleneck at the moment is to get feedback and ideas about how to improve the application! I would love you to help me out, by commenting on this blog post.
- What would love to be able to see and use in an application like this one?
- Which data would be really interesting in to view and explore in StormCenter?
- What kind of questions do you have, that an application like StormCenter could possibly solve?


I love what you’re doing and hope you make great progress with it! People could really use this resource for a number of things.
The only suggestion I would make is make sure your illustrated lines are clear and possibly opaque so you can see behind them.